


Market Snapshot
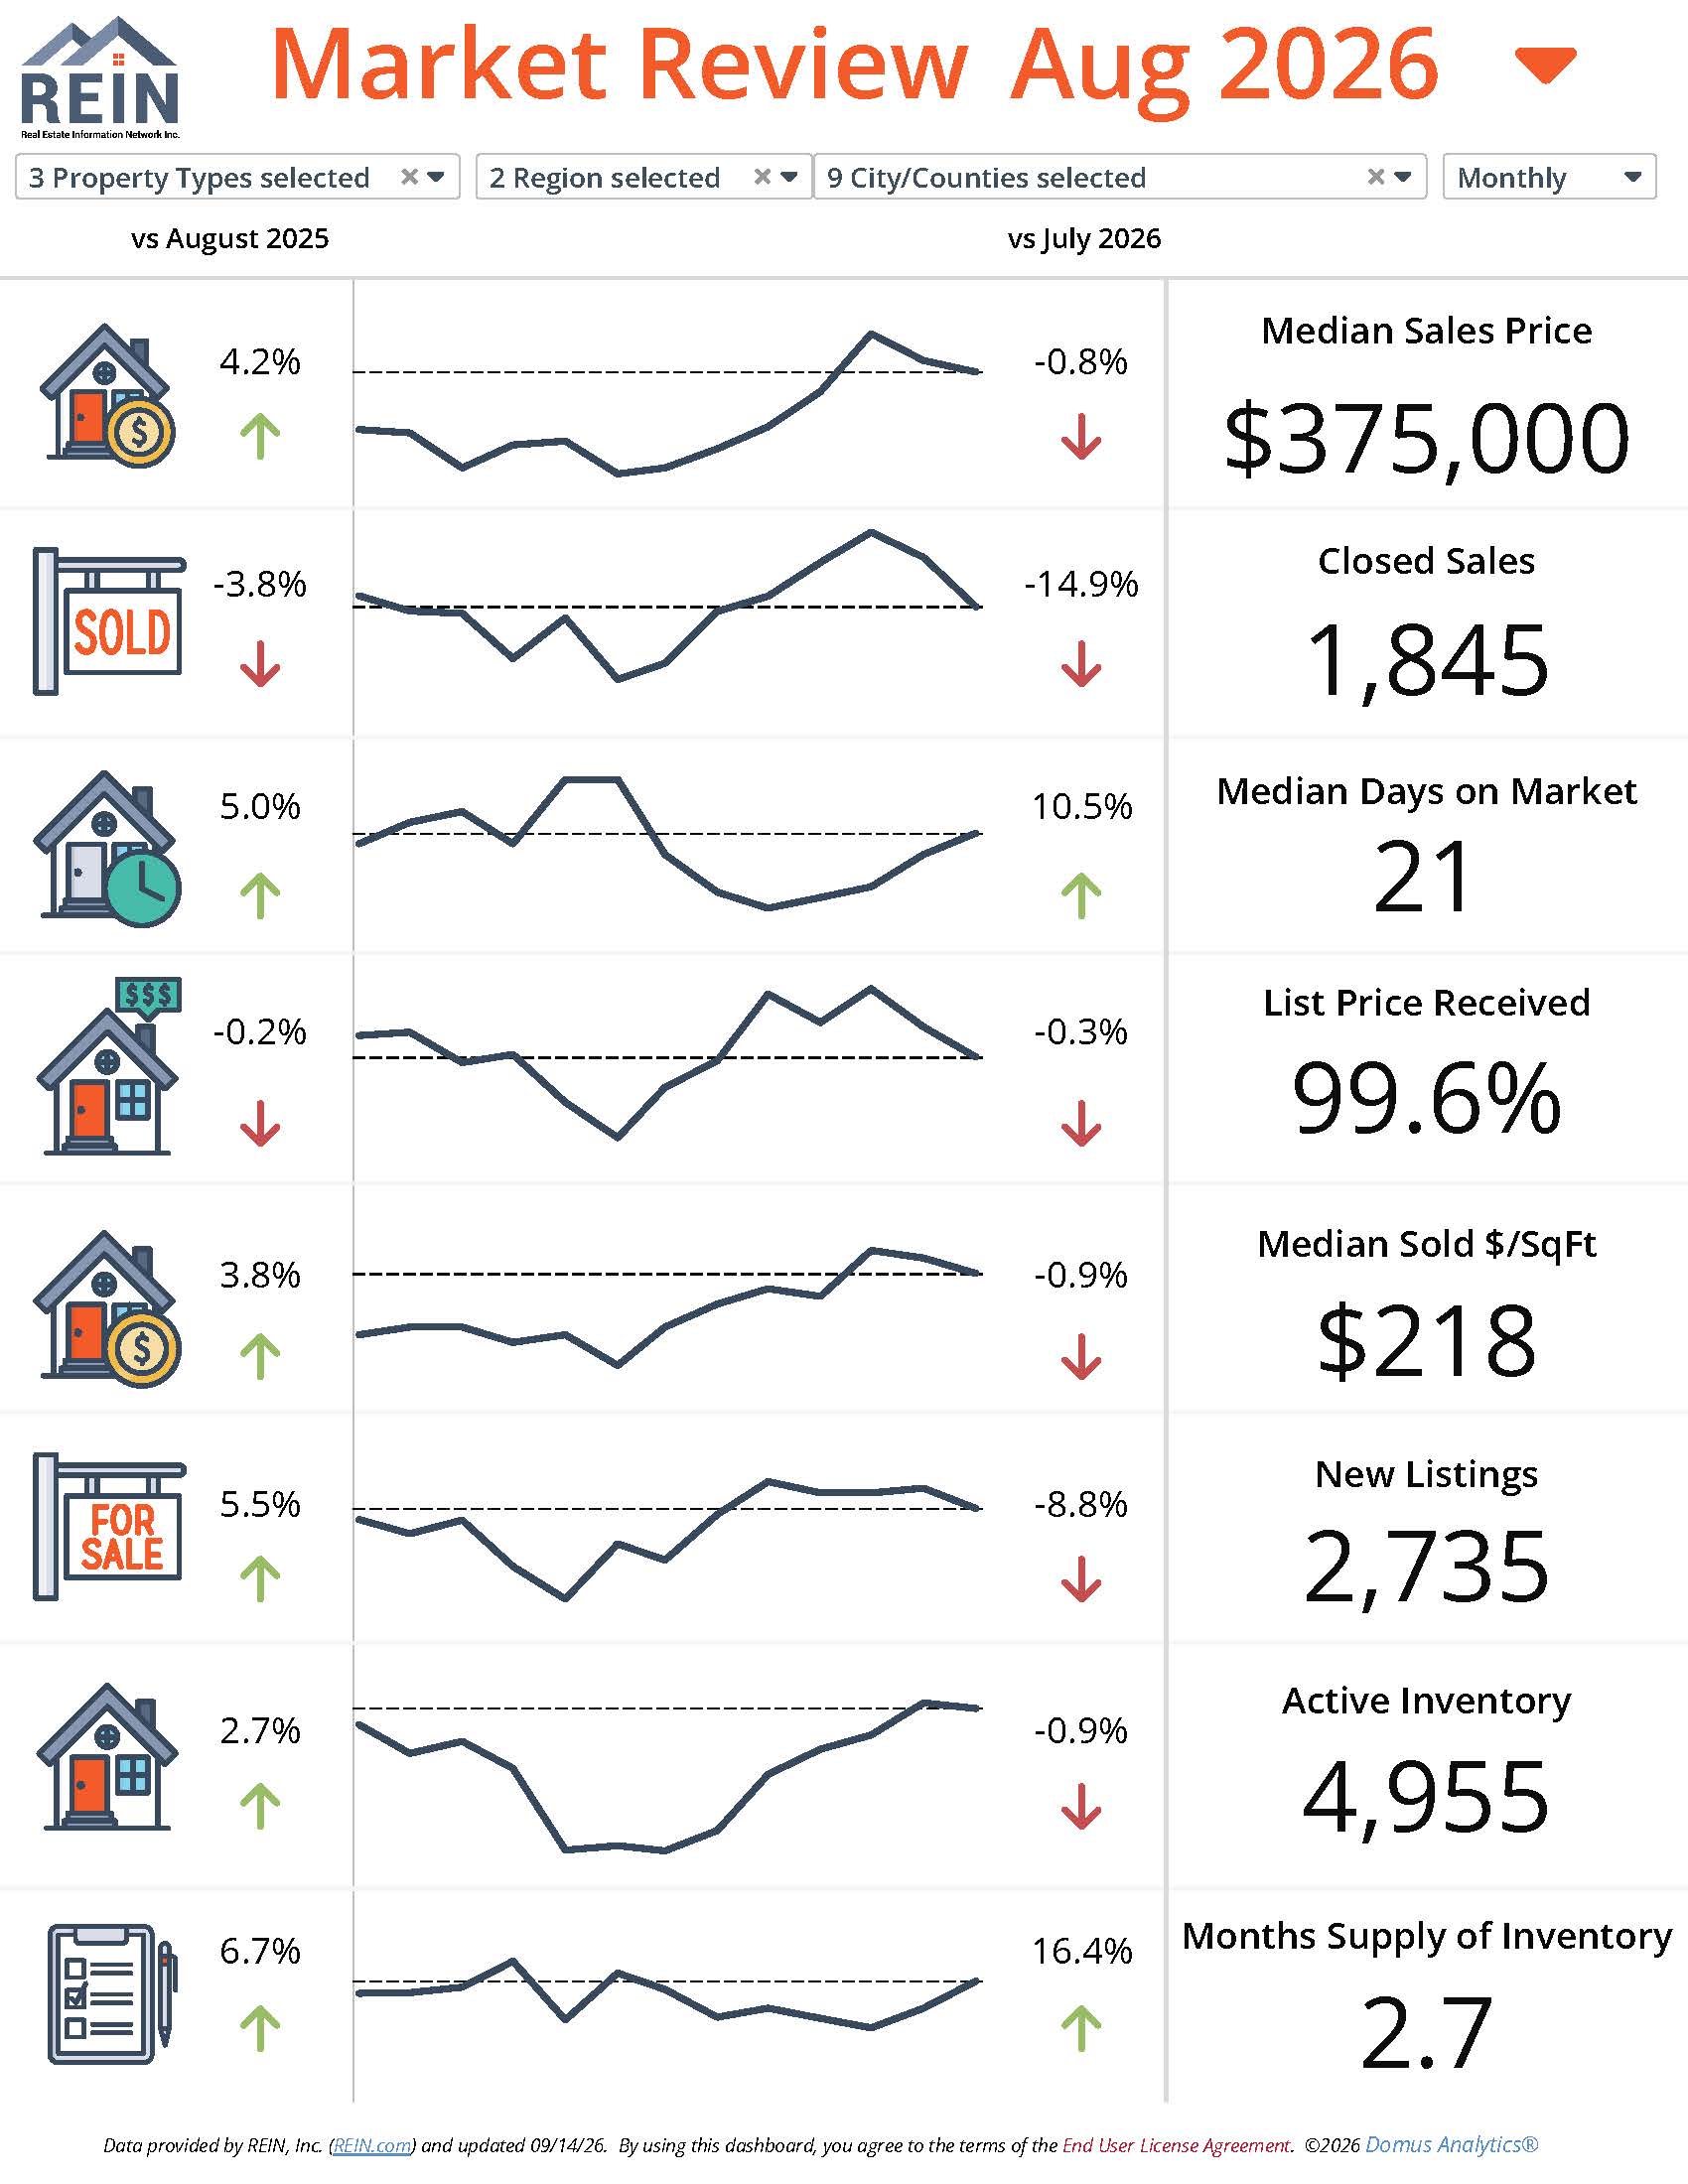
Stay ahead of the market with our latest real estate market update for Hampton Roads. In this month’s update, we break down the current trends in home prices, buyer demand, and housing inventory. Whether you're looking to sell, buy, or invest, understanding the latest market insights can help you make informed decisions. Watch the video for a detailed analysis of what’s happening in the real estate market right now. For additional insights, explore our written explanation below, where we cover key metrics, such as median home prices, mortgage rates, and time on market. Make sure you check out the visual snapshot of this month’s housing data to get a clear picture of the local real estate market.
Hampton Roads Housing Market Update: August 2026
What August 2026 Means for Buyers and Sellers
If you’ve been watching the Hampton Roads housing market and waiting for home prices to finally start falling, the August 2026 numbers offer an important reality check.
Buyers have more homes to choose from than they did a year ago. Homes are taking slightly longer to sell, and fewer transactions are closing.
But home prices?
They’re still higher than they were last year.
Across the Hampton Roads cities and counties included in this market update, the median sales price in August was $375,000 — 4.2% higher than August 2025.
So despite some of the headlines you may be seeing, this does not look like a housing market collapse.
Instead, Hampton Roads appears to be moving toward a more balanced market — and that means both buyers and sellers need to adjust their strategies.
Perhaps most importantly, Hampton Roads is not one single housing market. Conditions vary considerably from Virginia Beach to Suffolk, Hampton, York County, Isle of Wight and the surrounding communities.
Let’s take a closer look.
Hampton Roads Housing Market at a Glance
Across the nine Hampton Roads cities and counties included in this report:
Median sales price: $375,000
Year-over-year price change: +4.2%
Closed sales: 1,845
Median days on market: 21 days
Median sale-to-list price: 99.6%
Active listings: 4,955
Months of supply: 2.7 months
New listings: Up 5.5% year over year
The biggest change is inventory.
There were 4,955 homes actively for sale, an increase of 2.7% compared with last year. Months of supply also climbed to 2.7 months, up 6.7% year over year and 16.4% from July.
That gives buyers more choices and, in some cases, more negotiating room.
However, 2.7 months of inventory is still below what would traditionally be considered a balanced market. In other words, we have more inventory, but Hampton Roads is not suddenly flooded with homes.
There’s another important trend worth watching as we move into fall.
Although new listings were up 5.5% compared with last August, they declined nearly 9% from July. That may indicate the beginning of the normal seasonal slowdown in new inventory.
For buyers, that means waiting for a huge wave of additional homes to hit the market may not necessarily pay off.
For sellers, the message is equally important:
Buyers are still buying, but they are becoming more selective.
Condition, presentation and pricing matter more when buyers have additional options.
Virginia Beach Housing Market
Virginia Beach continues to have some of the strongest seller-side numbers in Hampton Roads.
The median sales price reached $435,000, an increase of 8.8% compared with August 2025.
Homes sold in a median of just 19 days, and sellers received approximately 99.6% of their asking price.
Inventory increased substantially — up 17.1% from last year — but Virginia Beach still had only 2.2 months of supply, the lowest inventory level among the markets included in this report.
What This Means for Virginia Beach Buyers
You have more choices than you did a year ago, but desirable, appropriately priced homes can still attract competition.
If you find a home that checks the right boxes, assuming it will sit while you decide could be risky.
What This Means for Virginia Beach Sellers
Demand continues to support prices, but increased inventory means your property has more competition.
Pricing appropriately and making sure the home shows well remain important.
Chesapeake Housing Market
Chesapeake's median sales price reached $438,700, up 3.9% year over year.
Homes took a median of 19 days to sell, while sellers received approximately 99.9% of their asking price.
The city had approximately 2.6 months of inventory.
New listings increased 5.5% compared with August 2025 but declined 7.4% from July.
What This Means
Chesapeake remains competitive, but buyers are getting a little more breathing room than they experienced during the extremely tight housing markets of recent years.
Sellers can still achieve strong results, but buyers have enough alternatives that preparation and pricing shouldn't be treated as an afterthought.
Norfolk Housing Market
Norfolk's median sales price was $340,000, up 1.5% from August 2025 and approximately 3% from July.
Homes took a median of 21 days to sell, and sellers received approximately 99.4% of list price.
Norfolk had 2.7 months of inventory.
Interestingly, active inventory was actually 3.7% lower than it was last August.
That is a good example of why looking only at regional Hampton Roads numbers can be misleading. While inventory is increasing overall, it isn't increasing evenly in every city.
Portsmouth Housing Market
Portsmouth recorded one of the strongest year-over-year price increases in August.
The median sales price reached $290,000, up 9.4% from August 2025.
Homes sold in a median of 22 days, and sellers received approximately 100.1% of asking price.
At the same time, active inventory was down 15.5% from last year, leaving Portsmouth with approximately 2.6 months of supply.
Despite fewer closed sales, limited inventory continues to create competition for homes buyers perceive as offering good value.
Suffolk Housing Market
Suffolk's numbers tell a somewhat different story.
The median sales price reached $422,763, an increase of 5.7% year over year.
However, homes took a median of 31 days to sell, longer than several of the other cities in this report.
Suffolk also had approximately 3.8 months of inventory.
Although that is actually lower than Suffolk's inventory level last year, it remains considerably higher than Virginia Beach, Chesapeake, Norfolk and Portsmouth.
What This Means for Suffolk Sellers
Pay very close attention to your direct competition.
Buyers have more homes to compare, which gives them greater ability to be selective about price, condition, upgrades and location.
Homes are certainly still selling, but simply putting a property on the market and expecting buyers to compete for it may not be enough.
What This Means for Suffolk Buyers
The additional inventory may give you more time to compare properties and potentially more negotiating leverage depending on the home.
That doesn't mean every seller is motivated or every property is negotiable, so the strategy should still be based on the individual listing.
Hampton Housing Market
Hampton's median sales price was $289,950, down approximately 1.7% from August 2025.
Homes took a median of 23 days to sell, with sellers receiving approximately 99% of asking price.
Months of supply reached 2.7 months.
Does a one-month decline in the median price mean Hampton home values are suddenly falling?
Not necessarily.
Median price represents the middle price of the homes that actually sold during that period. If the mix of homes sold changes — for example, if more lower-priced homes close during one month — the median can move even without a significant change in individual property values.
What we can say is that Hampton's August numbers were softer than several other markets in the region.
Newport News Housing Market
Newport News recorded a median sales price of $315,000, up approximately 3.1% from last year.
Homes took a median of 24 days to sell, while sellers received approximately 99.2% of asking price.
Inventory reached exactly 3 months of supply, up nearly 15% year over year.
Closed sales were also down nearly 12% compared with August 2025.
That combination gives buyers more opportunity to compare homes.
For sellers, it makes realistic pricing and positioning increasingly important.
York County Housing Market
York County had the highest median sales price in this report at $457,701, although that figure was approximately 4.1% lower than August 2025.
Homes took a median of 21 days to sell, and sellers received approximately 99.1% of asking price.
Inventory increased slightly to approximately 2.8 months of supply.
One important piece of context: York County recorded only 72 closed sales during August.
When the total number of transactions is relatively small, the types and price ranges of homes sold can have a larger effect on the median price.
For that reason, I would not use one month's median sales price alone to determine whether an individual York County property has increased or decreased in value.
Isle of Wight Housing Market
Isle of Wight had some of the most interesting numbers in this month's report.
The median sales price was $375,000, down approximately 16.7% from August 2025.
But context matters here too.
Only 39 sales closed during the month, so the relatively small number of transactions can significantly influence the median.
At the same time, active inventory increased nearly 43% year over year, and months of supply climbed to 4.1 months — the highest level among the markets included in this report.
Homes took a median of 28 days to sell.
Interestingly, sellers still received approximately 100.4% of their asking price.
Rather than simply concluding that “prices are falling,” I see a market where buyers have substantially more options, while homes that are priced and positioned appropriately can still perform well.
Is Hampton Roads Becoming a Buyer's Market?
Not regionwide.
Buyers clearly have more options than they did during the extremely inventory-constrained markets of recent years.
That is good news if you've been frustrated by having very few homes to choose from.
Depending on the property and location, buyers may now have:
More time to evaluate a home
More properties to compare
Greater opportunity to negotiate repairs or concessions
Less pressure to compromise simply because inventory is limited
But with only 2.7 months of supply regionally, Hampton Roads remains below what would traditionally be considered a balanced housing market.
And individual areas vary dramatically.
Virginia Beach had only 2.2 months of supply, while Suffolk had 3.8 months and Isle of Wight reached 4.1 months.
Those differences matter.
A buying strategy that makes sense in one city may not make sense 30 minutes away.
What Should Hampton Roads Sellers Do Right Now?
Homes are still selling, and regional home prices remain higher than they were one year ago.
But today's buyers have more choices.
That means they're less likely to overlook an overpriced home, poor presentation or obvious deferred maintenance when a better-positioned competing property is available nearby.
The old strategy of:
“It's a seller's market, so anything will sell”
is becoming increasingly risky.
The better approach is:
Give buyers a reason to choose your home.
That starts with understanding your direct competition, preparing the property properly, presenting it well and choosing a pricing strategy based on what is happening in your specific neighborhood — not simply what happened across Hampton Roads as a whole.
What Should Hampton Roads Buyers Do Right Now?
More inventory is giving buyers something they haven't had much of in recent years: options.
Use that to your advantage.
But don't confuse additional inventory with the idea that every seller must accept a low offer.
Homes that are updated, appropriately priced and located in highly desirable areas can still sell quickly.
Your strategy should consider:
The amount of inventory in the specific neighborhood
How long the property has been listed
Recent comparable sales
The home's condition
Recent price reductions
Competing homes currently for sale
The seller's apparent level of motivation
Those factors tell you much more about your negotiating position than a national housing headline ever will.
The Bottom Line
The August 2026 numbers point to a Hampton Roads housing market that is changing — but not collapsing.
Inventory has increased.
Buyers have more choices.
Some homes are taking longer to sell.
Yet regionwide prices remain higher than they were a year ago, and sellers are still receiving very close to their asking prices.
The biggest takeaway is simple:
Real estate is becoming increasingly local again.
What's happening in Virginia Beach isn't identical to what's happening in Suffolk. York County isn't Hampton. And Isle of Wight has a very different inventory picture from Chesapeake.
If you're planning to buy or sell, the most useful question isn't simply:
“Is the Hampton Roads market up or down?”
It's:
“What's happening with homes like mine — or homes I want to buy — in the specific area I'm considering?”
I'm Kerry Tanner, Realtor with AtCoastal Realty, and I help buyers and sellers relocate to, from and throughout Hampton Roads and the surrounding areas.
If you're thinking about buying or selling and would like to understand what today's market means for your specific situation, schedule a consultation with me. We'll look at the numbers, your goals and your options so you can make an informed decision without pressure.
And if you'd like to stay informed about the Hampton Roads real estate market, check back each month for the latest market update and a practical breakdown of what the numbers actually mean for local buyers, sellers and homeowners.